The Edit Menu
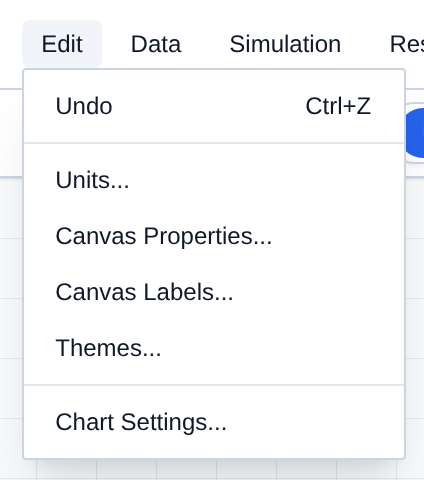
The Edit menu covers undo plus workspace-wide settings: units, canvas appearance, canvas labels, UI theme, and the telemetry chart window.
Here is a breakdown of every option in the Edit menu:
- Undo: Reverts the last canvas change (moving a node, drawing a pipe, deleting a component, and similar edits). Shortcut: Ctrl+Z.
- Units...: Opens Unit Settings for display units and project currency.
- Canvas Properties...: Background color, grid visibility, and grid style.
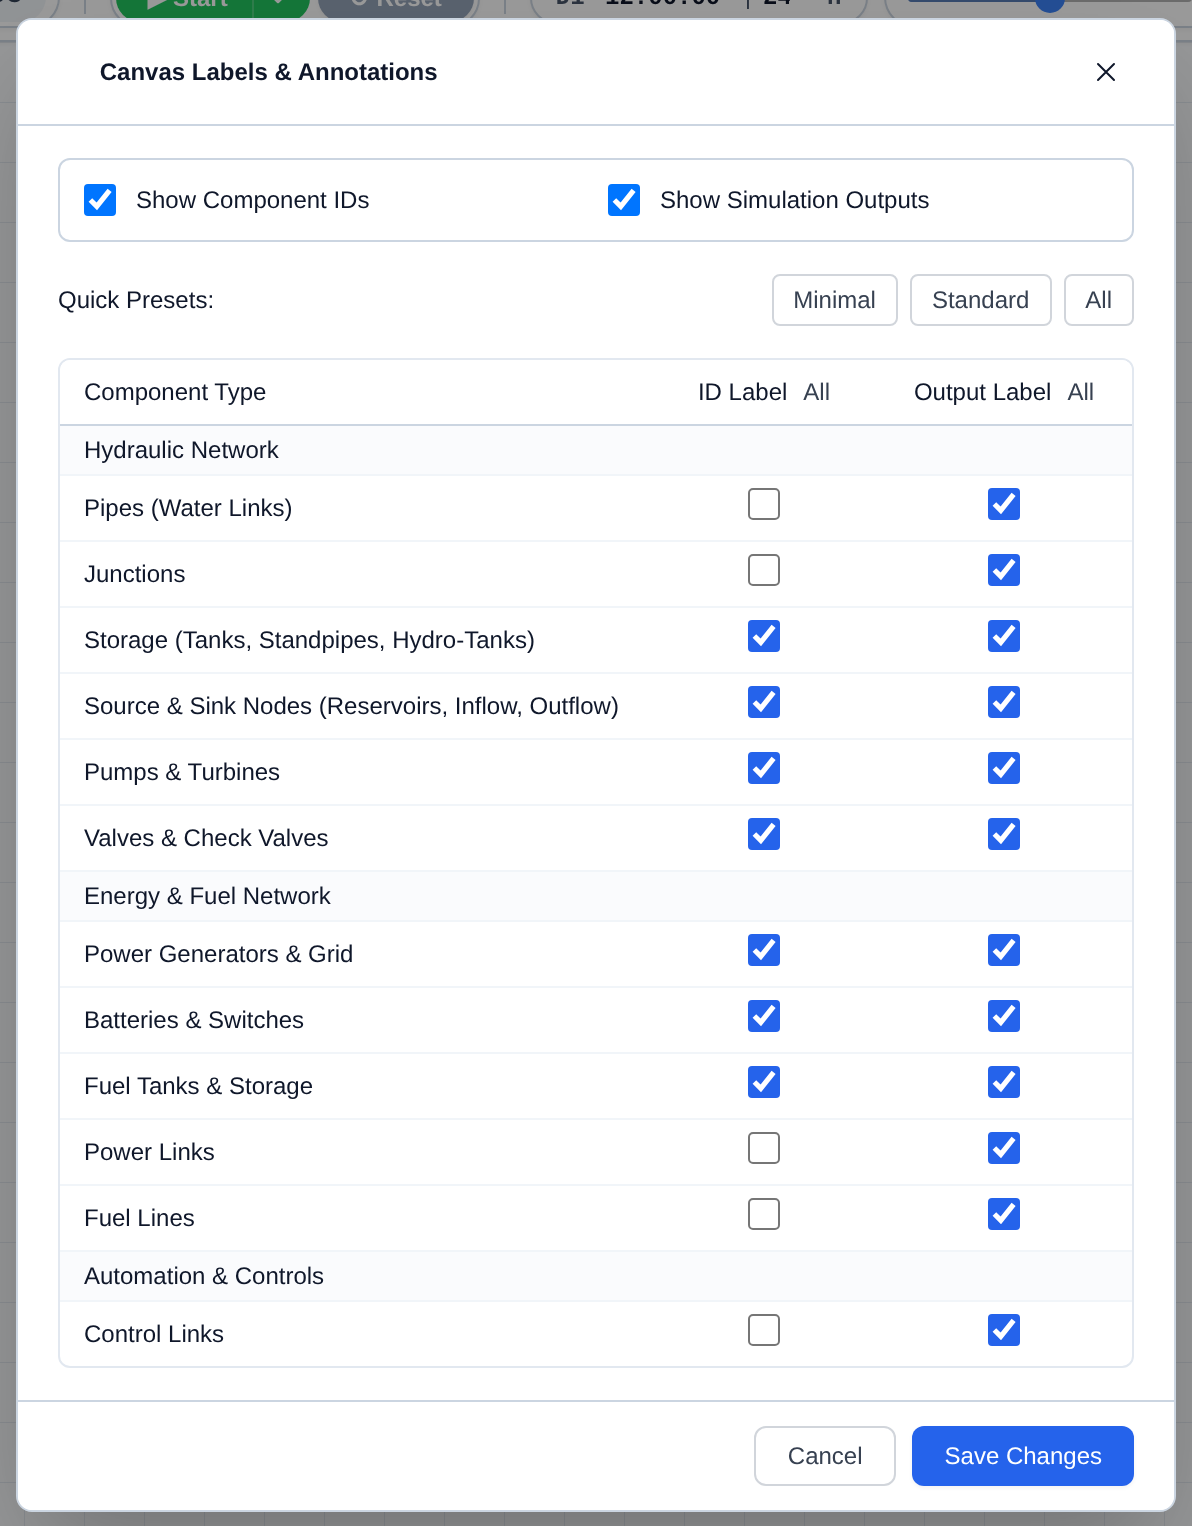
- Canvas Labels...: Show or hide component ID and simulation output labels on the canvas, globally or per component type.
- Themes...: Applies a UI theme to the editor chrome.
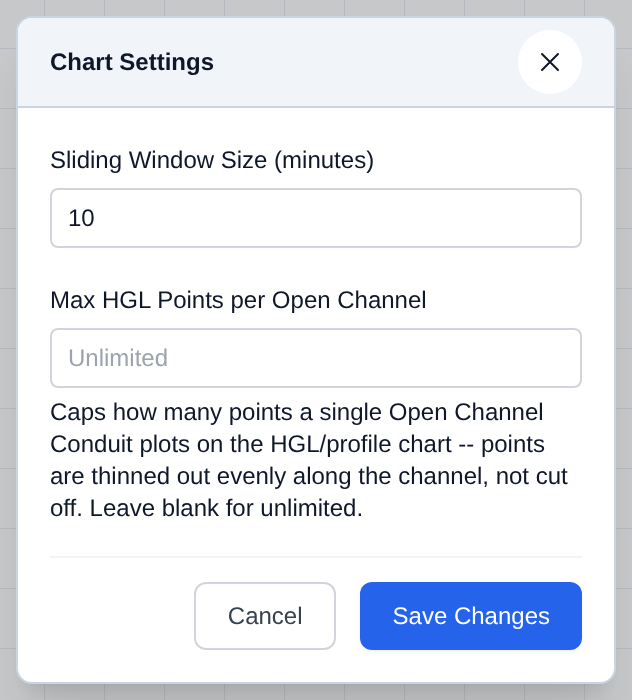
- Chart Settings...: Sliding window length for Sliding Charts (not History Charts), plus a point cap for Open Channel Conduit HGL/profile charts.
Units
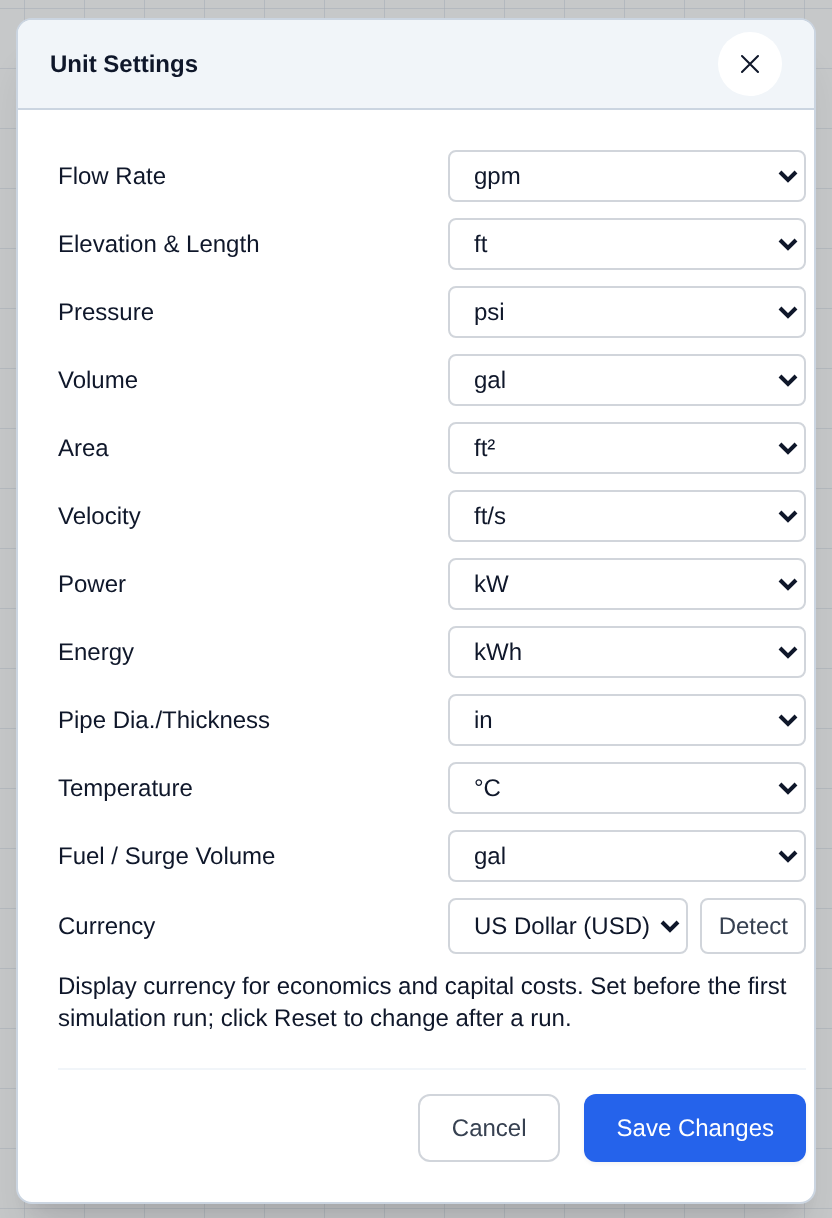
Open Edit → Units... to set the display units used throughout the editor and solver inputs.
- Open Edit and choose Units....
- Pick units for flow, elevation and length, pressure, volume, area, velocity, power, energy, pipe diameter/thickness, temperature, and fuel/surge volume.
- Set Currency for economics and the cost estimator. Detect guesses currency from Site Location.
- Click Save Changes.
Units and currency cannot be changed while a simulation is running or paused — click Reset first. Set currency before the first run.
[!IMPORTANT] Set Units before you build a large network so pipe diameters, tank elevations, and similar inputs are interpreted correctly by the hydraulic solver.
Canvas Properties
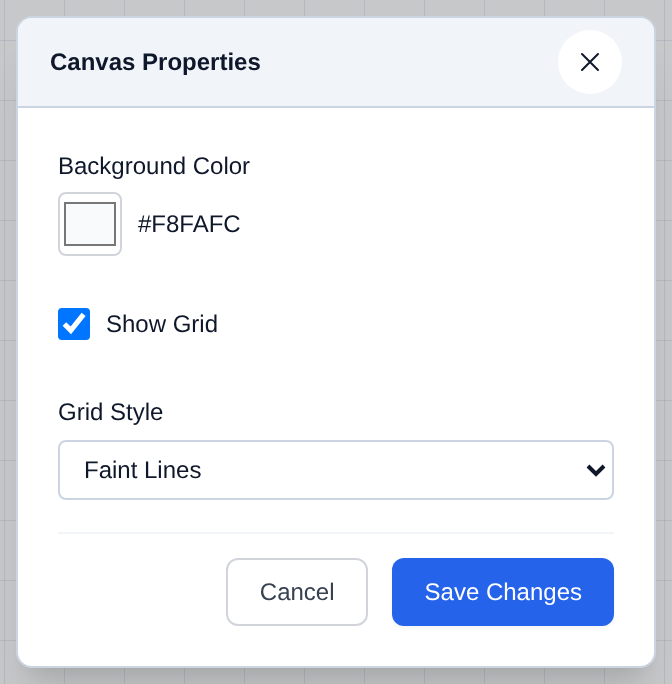
Open Edit → Canvas Properties... to change how the drawing space looks. These settings are stored with the project.
- Open Edit and choose Canvas Properties....
- Set Background Color with the color picker.
- Toggle Show Grid and, if the grid is on, choose Grid Style (Dots or Faint Lines).
- Click Save Changes.
Canvas Labels
Open Edit → Canvas Labels... to control which ID and live-simulation-output labels are drawn on the canvas next to each component. These are display-only and are stored with the project; they do not change the model.
- Open Edit and choose Canvas Labels....
- Use the master toggles to turn Show Component IDs and Show Simulation Outputs on or off for the whole canvas.
- Or pick a Quick Preset: Minimal (labels mostly off), Standard (a balanced default), or All (every label on).
- For finer control, use the table below the presets to set the ID Label and Output Label columns per component type, grouped as Hydraulic Network (Pipes, Junctions, Storage, Source & Sink Nodes, Pumps & Turbines, Valves & Check Valves), Energy & Fuel Network (Power Generators & Grid, Batteries & Switches, Fuel Tanks & Storage, Power Links, Fuel Lines), and Automation & Controls (Control Links). The All link atop each column toggles that whole column at once.
- Click Save Changes.
Themes
Open Edit → Themes... to change the editor chrome and colors. This does not change the hydraulic model.
- Open Edit and choose Themes....
- Choose a theme (Default R-THYM, STREAM-1D, National Park, Forest Bath, Black Gold, Mocha Latte, Coastal Vibes, or Rustic Charm).
- Click Apply Theme.
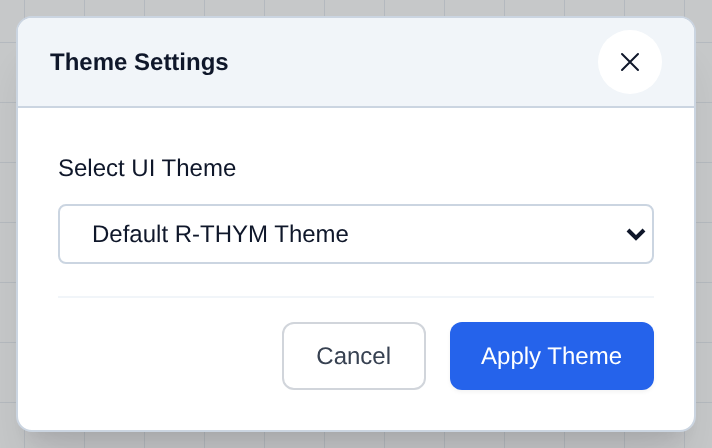
Chart Settings
Open Edit → Chart Settings... to set how many minutes a Sliding Chart shows at once. This does not change History Charts, which keep the full run.
- Open Edit and choose Chart Settings....
- Set Sliding Window Size (minutes).
- Optionally set Max HGL Points per Open Channel to cap how many points a single Open Channel Conduit plots on the HGL/profile chart. Points are thinned out evenly along the channel, not cut off. Leave blank for unlimited.
- Click Save Changes.