The Canvas
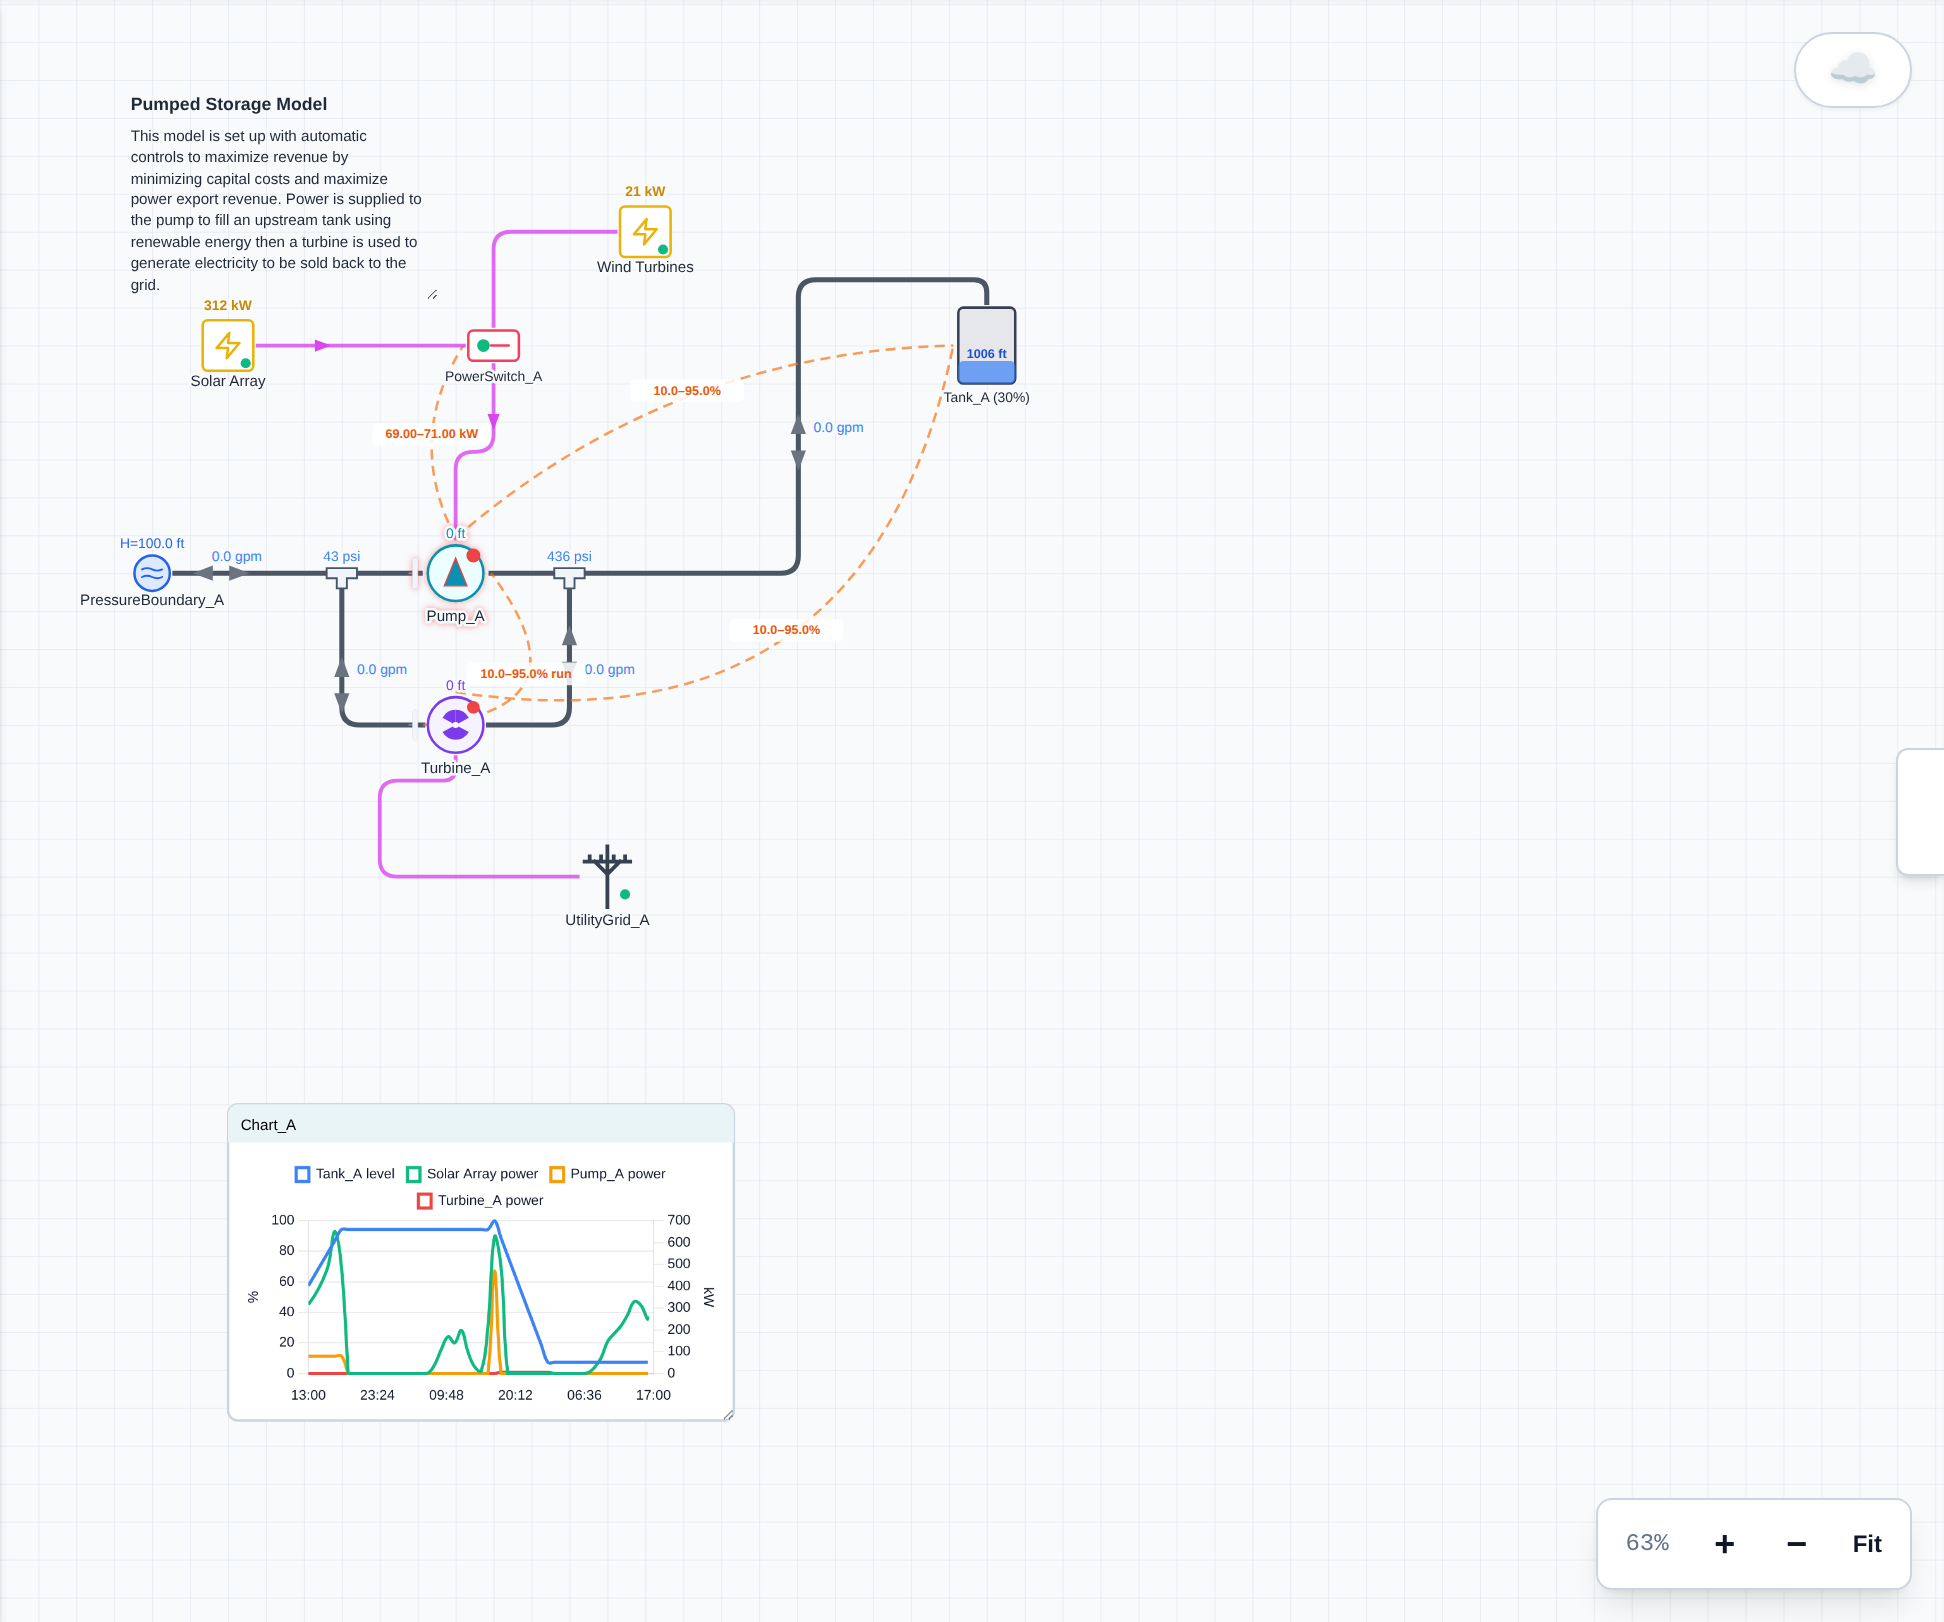
The canvas is the drawing workspace in the middle of the editor. Nodes, links, charts, and notes all live here. The screenshot above is the published Pumped Storage Hydropower example after an EPS run, with a History Chart on the canvas so you can watch tank level and power while the rest of the schematic stays in view.
This is the usual creation workflow: drop nodes from the Component Toolbar, then draw pipes and other links between them. Pan, zoom, select, and edit on the same surface.
The left Component Toolbar and right Telemetry Panel are documented with the rest of the chrome. Canvas appearance (background and grid) is under Edit → Canvas Properties.
[!NOTE] You cannot add or reconnect components while a run is locked. Click Reset on the simulation control bar first.
Pan and zoom
Move around the drawing space before you place anything, and again as the network grows.
- Pan: Left-click empty canvas and drag. On a trackpad, a two-finger drag also pans.
- Zoom: Scroll the mouse wheel (or pinch on a trackpad). Forward zooms in; backward zooms out.
- Zoom controls: The cluster in the bottom-right of the canvas shows the current scale, +, −, and Fit. Fit frames every component in the viewport.
100% is the default scale. Use Fit, or zoom out (often around 60–75%), when a chart or a distant tank sits below the fold.
Adding nodes
Nodes are the physical locations and equipment in the model: sources, tanks, pumps, junctions, turbines, electrical gear, charts, and notes.
- In the Component Toolbar on the left, press and hold the icon you want.
- Drag it onto the canvas.
- Release to drop it. The new node snaps to the grid.
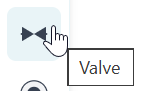
Some toolbar icons open a flyout (storage tanks, valves, surge devices). Hover the parent icon, then drag the specific type from the flyout.
Left click on the icon you wish to add:
Drag onto the canvas:
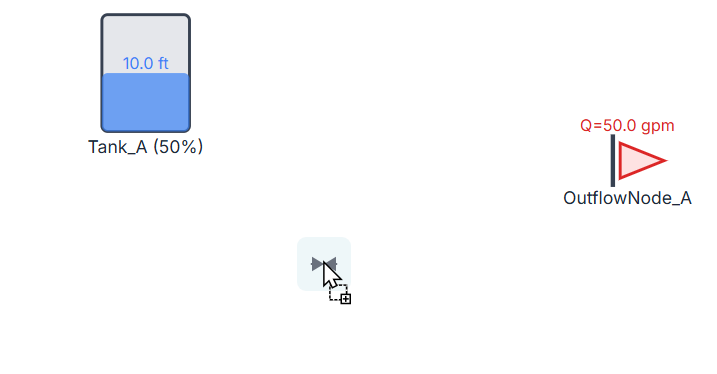
Drop by releasing the mouse button:
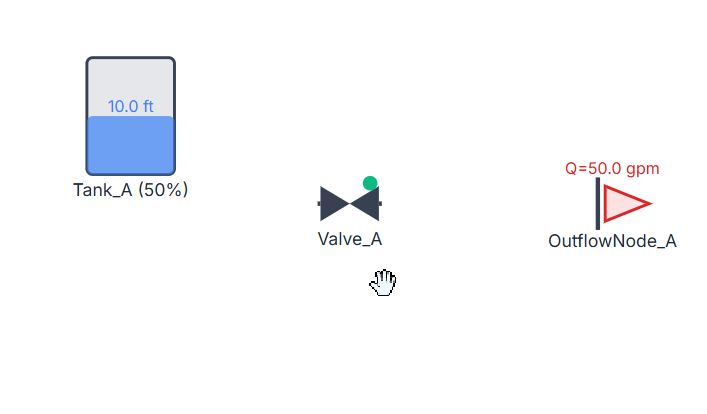
Charts and text notes use the same drag-and-drop. Sliding Chart and History Chart are the last icons above Text Note.
Adding links
Links connect two existing nodes. They cannot be dropped on empty canvas. Use the link tools in the Component Toolbar:
- Pipe — fluid between hydraulic nodes.
- Power Link — electrical energy between power components.
- Fuel Link — fuel tank to a combustion generator.
-
Control Link — an operating rule from equipment (pump, valve, turbine, and similar) to a sensor (tank, pump, turbine, and similar).
-
Click the link tool (Pipe, Power Link, Fuel Link, or Control Link). A banner at the top of the canvas tells you what to click next.
- Click the source node. It highlights when the pointer is over a valid connection.
- Click the destination node to draw the link.
- Press Esc at any time to cancel.
Click the same tool again to leave link mode. After a pipe is drawn, the pipe properties dialog opens so you can set length, diameter, and related inputs.
Charts on the canvas
Drop a chart node when you want a plot in the schematic itself, next to the equipment it describes.
- Sliding Chart — a moving time window of the latest values. Window length is Edit → Chart Settings.
- History Chart — the full run so far (the chart in the pumped-storage screenshot).
Double-click a chart (or right-click → Properties) to pick series, axes, and title. The Telemetry Panel on the right still shows the selected component; canvas charts are extra views you place yourself.
Notes
Text Note is a visual annotation only. It does not affect the hydraulic or energy solve. Creating, resizing, and formatting notes is on Canvas Notes.
Selecting and editing
- Select / telemetry: Left-click a node or link. The Telemetry Panel shows that component. Click empty canvas for the system overview.
- Properties: Double-click, or right-click and choose Properties.
- Move: Left-click and drag a node. Connected pipes stretch with it.
- Multi-select: Hold Shift and drag a box, or Shift-click additional components.
- Copy and paste: Ctrl+C / Ctrl+V (Cmd on macOS). Shift-drag a box first to copy several components at once.

- Delete: Right-click → Delete, or press Delete / Backspace with the component selected.
Weather HUD
The Weather HUD sits in the top-right of the canvas. The pill shows at-a-glance conditions that affect energy physics (solar radiation and temperature). Click it to open a small overlay on the canvas and to load Environment telemetry on the right.
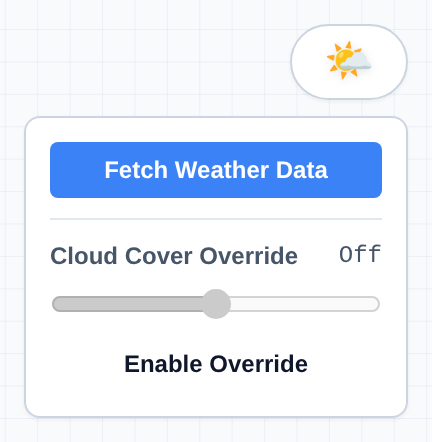
From that overlay you can refresh the project's climate and override cloud cover:
- Click the Weather HUD pill.
- Click Fetch Weather Data to load (or refresh) hourly forecast climate for the coordinates already saved on the project. The button reads Fetching..., then Updated, and the Telemetry Panel charts update.
- Optionally click Enable Override and drag Cloud Cover Override to impose a manual cloud fraction (0–100%) and test how solar and storage respond to a drop in irradiance. Disable Override returns to the fetched series.
Set city, latitude, and longitude in Data → Site Location. That dialog's Fetch Site Data also loads regional cost and currency defaults. The HUD button is climate only, and it writes immediately (no extra Save). Sources and forecast horizon are in Appendix F: Site Weather Data.
[!NOTE] Fetch Weather Data needs a saved site location and is disabled while a run is locked. Click Reset first, or set coordinates under Data → Site Location... if the project has none.